Rule Refinement
CHARTextract displays mismatches between the tool’s predictions and labels (i.e., the “ground truth” labels). With this information, the user can modify the rules and update the tool’s predictions. This iterative process, known as rule refinement, allows for quick development and thorough debugging of the rules.
Understanding the interface
-
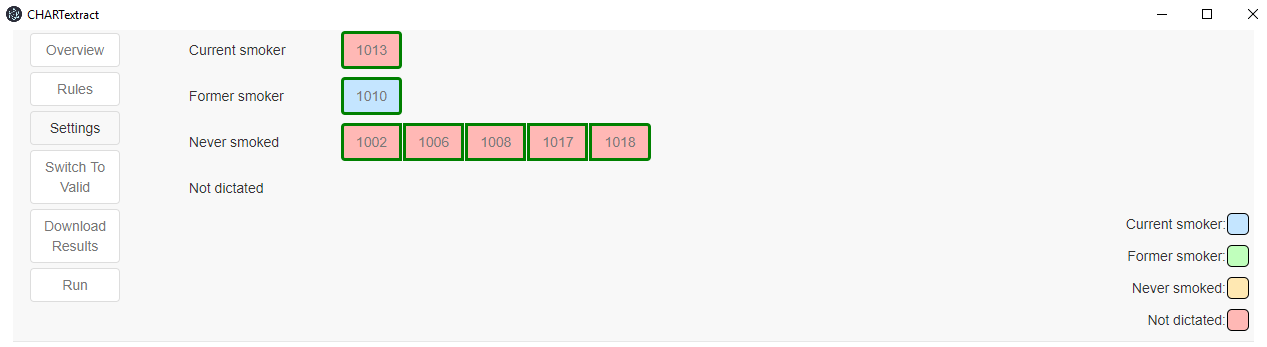
After developing an initial set of rules and pressing on the `Run’ button, there may be some buttons with data IDs in the navigation pane. These represent the mismatched charts. A mismatch occurs when the tool predicts a label that is different from the one specified in the labels file.
-
The mismatched data IDs are organized and color-coded for quick evaluation. The buttons are placed next to their true label. The background color of the button indicates the tool’s prediction.
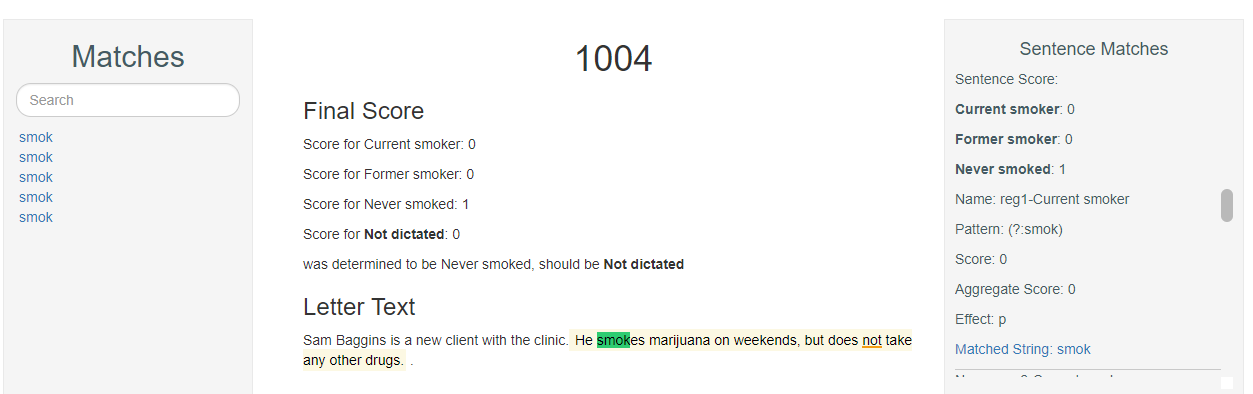
- Pressing on the mismatched button will pull up the text data and will provide more information on the mismatch.
- By scrolling through the mismatched note and pressing on the highlighted text, you can see which rule matches lead to changes in scores.
-
Based on this information, you may re-visit the Rules page and modify existing rules. After modifying the rules, press on the
Runbutton. -
Changes made following rule changes will be flagged by the color of the button border. If the border is green, that means that no changes have happened to the mismatched instance. Any new mismatches that appear following the rule changes will have a red border around them.
Legend
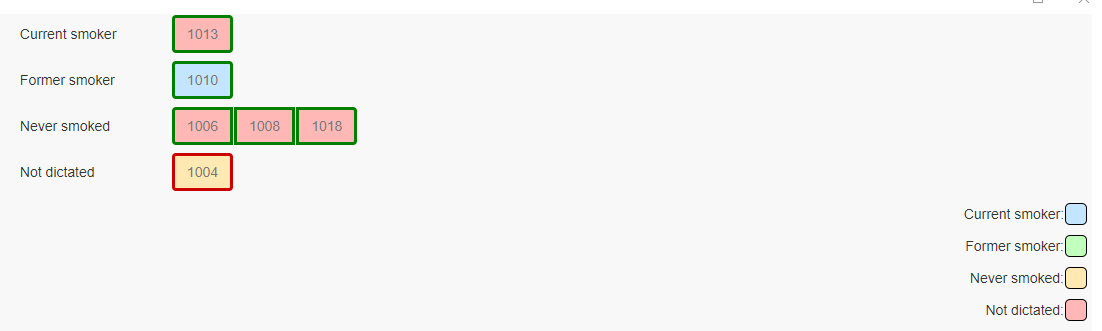
-
A red border around a button indicates that this is a new mismatch that appeared since the previous run.
-
A green border around a button indicates that there was no change since the previous run.
-
A yellow highlight will indicate that a sentence matched with one of the rules.
-
Clicking on the sentence will display a green highlight indicating the exact match.
-
Any words that match an Ignore rule will be shown with a red underline.