Overview
Navigation pane
After launching CHARTextract, use the buttons in the navigation pane (top-left) to navigate through the different functionalities of the tool. 
Overview
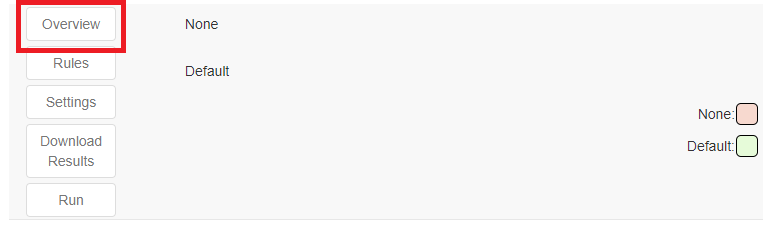
The Overview functionality displays results when using CHARTextract. The results include the variable name and metrics for each of the variable labels. 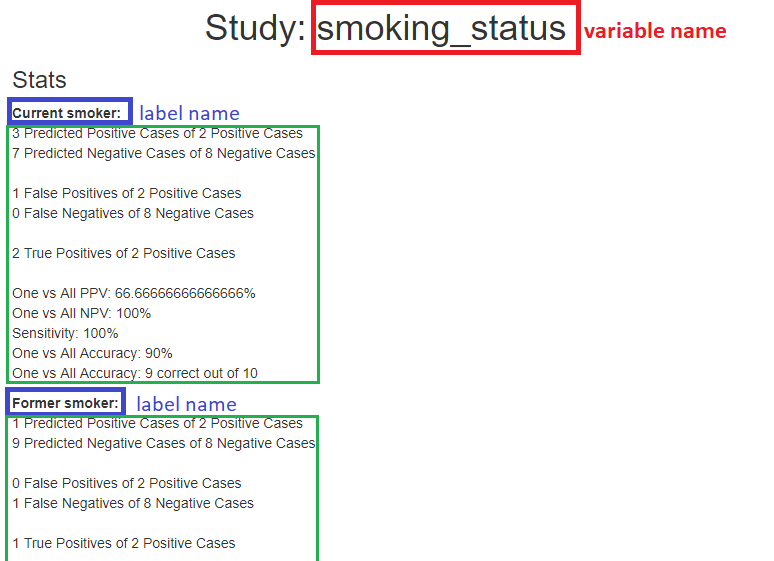
After writing rules and running them, the Overview functionality will report the following metrics on the data set for each label:
- Predicted positive cases: The total number of cases which are predicted to be of the label.
- Predicted negative cases: The total number of cases which are predicted to not be of the label.
- False Positives: The total number of cases which were predicted to belong to the given label AND which actually do NOT belong to the given label.
- False Negatives: The total number of cases which were predicted to NOT belong to the given label AND which actually do belong to the given label.
- True Positives: The total number of cases which were predicted to belong to the given label AND which actually do belong to the given label.
- One vs All PPV (%): The total number of True Positives divided by the total number of Predicted positive cases.
- One vs All NPV (%): The total number of False Negatives divided by the total number of Predicted negative cases.
- One vs All Accuracy (%): The total number of True Positives plus the total number of True Negatives, divided by the total number of cases.
Rules
The Rules functionality is where rules are created. Rules are at the core of how CHARTextract works. Rules consist of a pattern matching component and an associated score. They can be created using the Basic View or the Advanced View.
Rules in CHARTextract rely on regular expressions. Knowledge in regular expressions is not required, but may be useful for constructing more complicated rules.
For more details, refer to the Rules documentation page.
Settings
The Settings functionality is where project-, variable-, and classifier-specific settings are specified.
Use the Project Settings view to specify the data files, the rules folder and (optionally) the dictionaries folder.
Use the Variable Settings view to specify settings related to the variable to extract.
Use the Classifier Settings view to specify settings related to the classifier, including the classifier type and the name of negative label.
For more details, refer to the Settings documentation page.
Download results
The Download Results functionality generates a CSV file and saves this file to the specified location. If running the tool with Prediction mode set to True, the results file will contain predicted labels for every case. If running the tool with Prediction mode set to False, the results file will contain true labels and predicted labels for cases in which there is a discrepancy between the true and predicted label.
Run
After writing rules, press on the Run button to run CHARTextract.